
Selecting a mutual fund based solely on past returns is akin to driving while looking only in the rearview mirror—it tells you where you’ve been, but nothing about the road ahead. Astute investors understand that performance must be evaluated in the context of risk and cost. This is where mutual fund ratios come in.
Mutual fund ratios are mathematical metrics that provide a deeper, quantifiable look into a scheme’s risk profile, the fund manager’s skill, and the expenses involved. They transform raw return data into actionable insights, allowing investors to compare funds on a like-for-like basis and ensure their choice aligns with their personal risk tolerance and financial goals.
This article explores the most vital mutual fund ratios, categorising them by the insights they provide, and explains why they are indispensable tools in the fund selection process.
1. Ratios for Assessing Risk and Volatility
These ratios help you quantify how “bumpy” the investment journey will be. They are crucial for conservative investors and those with shorter time horizons.
1.1. Standard Deviation (SD)
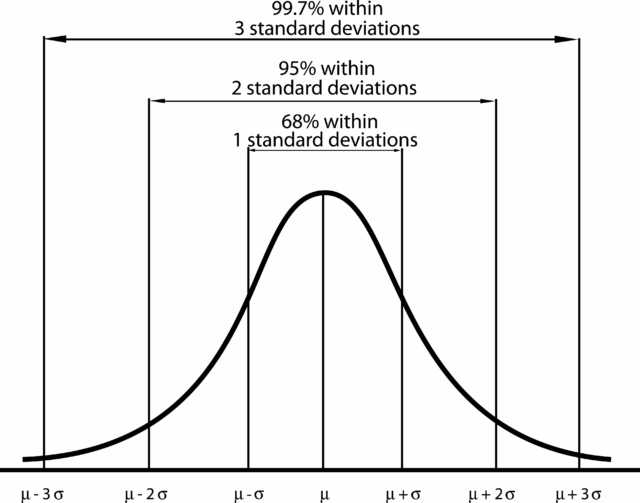
Standard Deviation is the most straightforward measure of a fund’s absolute volatility or risk. It quantifies how much the fund’s returns deviate from its historical average return.
- Interpretation:
- High SD: The fund’s returns have historically swung widely (both up and down) from its average, indicating high volatility and higher risk.
- Low SD: The fund’s returns are more consistent and predictable, indicating lower volatility and lower risk.
- Importance: It tells you the potential range of returns you can expect. For example, if a fund has an average return of 12% and an SD of 10%, its returns typically fall between 2% and 22%. Investors with a low-risk appetite should prefer funds with a lower Standard Deviation within the same category.
1.2. Beta (ß)
Beta is a measure of a fund’s systematic risk or its sensitivity to the movements of its benchmark index (like the Nifty 50).
- Interpretation:
- ß = 1: The fund’s price moves in line with the benchmark.
- ß > 1 (e.g., 1.2): The fund is 20% more volatile than the benchmark. It is expected to rise 1.2% when the index rises 1%, but also fall 1.2% when the index falls 1%. This is preferred by aggressive investors.
- ß < 1 (e.g., 0.8): The fund is 20% less volatile than the benchmark. It offers more stability and is generally preferred by moderate or conservative investors.
- Importance: Beta helps you understand the relative risk of the fund. It is crucial for assessing how a fund will behave during a market-wide rally or crash.
Hybrid funds and arbitrage funds are having low beta ratio.
2. Ratios for Measuring Risk-Adjusted Returns
The true measure of a fund manager’s skill isn’t just generating high returns, but generating high returns without taking on excessive risk. These ratios are the gold standard for comparison.
2.1. Sharpe Ratio
The Sharpe Ratio measures the excess return generated by a fund for each unit of total risk taken (as measured by Standard Deviation).
Sharpe Ratio = (Portfolio return- Risk-free rate)/ Portfolio’s Standard Deviation.
- Interpretation:
- Higher the Sharpe Ratio, the Better. A higher ratio indicates that the fund has historically delivered better returns for the level of risk it assumed.
- Importance: It is the primary tool for comparing two funds with different volatilities. A fund with a 15% return and a high SD might have a lower Sharpe Ratio than a fund with a 12% return and a low SD, making the latter the superior, risk-efficient investment.
2.2. Sortino Ratio
The Sortino Ratio is a refinement of the Sharpe Ratio. It focuses only on downside risk (negative volatility, or “bad” volatility) by replacing Standard Deviation with Downside Deviation in the denominator.
- Interpretation:
- Higher the Sortino Ratio, the Better. It tells you how well the fund is managing the risk of poor performance (losses).
- Importance: Investors who are particularly concerned about protecting capital during market downturns should use the Sortino ratio, as it rewards funds that avoid large drawdowns, irrespective of how volatile they were on the upside.
2.3. Alpha (α)
Alpha is arguably the most direct measure of a fund manager’s skill. It represents the excess return a fund generates compared to what it was expected to generate given its Beta (systematic risk) and the market’s return.
Alpha = Actual Return -Expected Return (based on CAPM)
Interpretation:
- Positive Alpha: The fund manager has “beat the market” on a risk-adjusted basis. This is a result of good stock selection and timing.
- Negative Alpha: The fund has underperformed its benchmark, even after adjusting for the risk it took.
- Importance: For investors in actively managed funds, a consistently positive Alpha is the main reason for paying a higher expense ratio. It signifies the true value added by the fund manager.
3. Ratios for Evaluating Fund Efficiency and Cost
These ratios address the non-performance aspects that directly impact your net return.
3.1. Expense Ratio
The Expense Ratio is the percentage of a fund’s average net assets that is used to pay for administrative and management costs, marketing, and distribution. It is deducted from the fund’s assets before the NAV is calculated.
- Interpretation:
- Lower the Expense Ratio, the Better. Since this cost is deducted regardless of performance, a lower expense ratio means a higher potential return for the investor.
- Importance: Over a long period, even a small difference in the expense ratio can lead to a significant difference in final wealth accumulation due to compounding. This ratio is why Direct Plans (which have a lower expense ratio) are generally preferred over Regular Plans (which include a distributor commission).
3.2. Portfolio Turnover Ratio (PTR)
This ratio measures how frequently the fund manager buys and sells the securities in the fund’s portfolio over a year. It is expressed as a percentage of the fund’s assets.
- Interpretation:
- High PTR: Indicates an active, high-conviction trading strategy, which typically leads to higher transaction costs (brokerage, taxes) and potentially higher capital gains tax liability for the investor.
- Low PTR: Indicates a buy-and-hold strategy, suggesting lower transaction costs and greater tax efficiency.
- Importance: Aggressive investors might accept a high PTR if the fund consistently delivers a high Alpha. However, conservative investors often prefer a lower PTR due to the associated lower costs and greater stability.
4. Other Supporting Ratios
- R-Squared (R2): Measures the correlation between a fund’s performance and its benchmark. An R2 value close to 100% suggests the fund is highly correlated with the index (like a passive fund), making Beta a reliable risk measure. A low R2 suggests the fund is managed actively and its returns are driven by factors other than the market index.
- Treynor Ratio: Similar to the Sharpe Ratio, but measures the excess return per unit of systematic risk (Beta) instead of total risk (Standard Deviation). It is best used for evaluating a well-diversified portfolio where unsystematic risk is largely eliminated.
Conclusion: The Holistic Approach
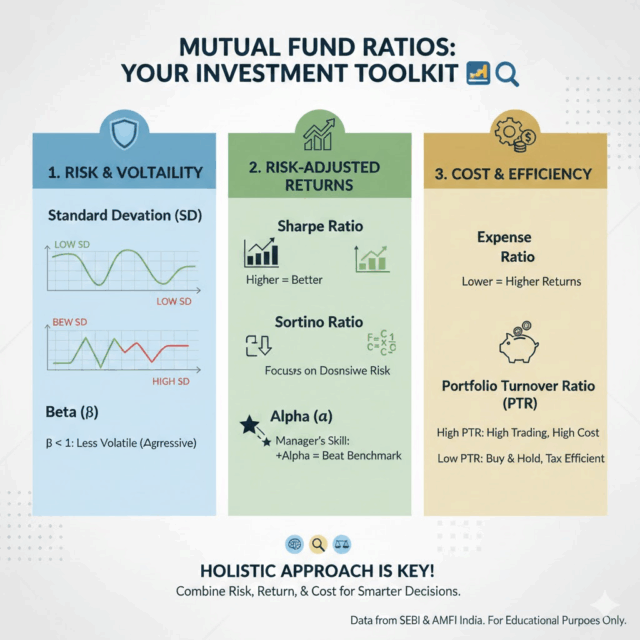
No single ratio can provide a complete picture of a mutual fund. The truly informed decision involves a holistic analysis of these metrics:
- Start with Risk: Use Standard Deviation and Beta to ensure the fund’s volatility aligns with your risk tolerance.
- Evaluate Skill: Use Sharpe Ratio, Sortino Ratio, and Alpha to determine if the manager is generating returns efficiently and adding value beyond the benchmark. A high Alpha with a good Sharpe Ratio is the ideal combination.
- Check Cost: Always confirm the Expense Ratio and choose a low-cost plan to maximize your net returns over the long term.
By incorporating these ratios into your due diligence, you move beyond mere historical return chasing and adopt a disciplined, quantitative approach to mutual fund selection, dramatically improving your chances of achieving your long-term financial objectives.